UPDATE: Since I wrote this earlier, I’ve come across two good discussions on the role of “Hope” in the face of these charts and the overwhelming science of climate change.
- This interview with scientists and experts contrasts these same 4 charts with what gives them hope.
- This really good thread and podcast discussion by The Hot Take co-founder Mary Annaïse Heglar makes the argument that it’s not hope, but resolve, action, and some other things that are necessary in this moment.
I agree with both parts: that we need more hope, and that the antidote to fear is not hope, but action and conviction in the face of uncertainty. If you agree and are able, I hope you’ll click here to donate.
As has become a tradition, I’m going to tell the story of where our climate and common home is at with a series of charts and graphs. Next week I’ll send you a year in photos so you can look back at some of what we’ve done this year.
But if you’re already all in – here’s the link to donate, and thanks.
Chart 1 – Tipping points ahead
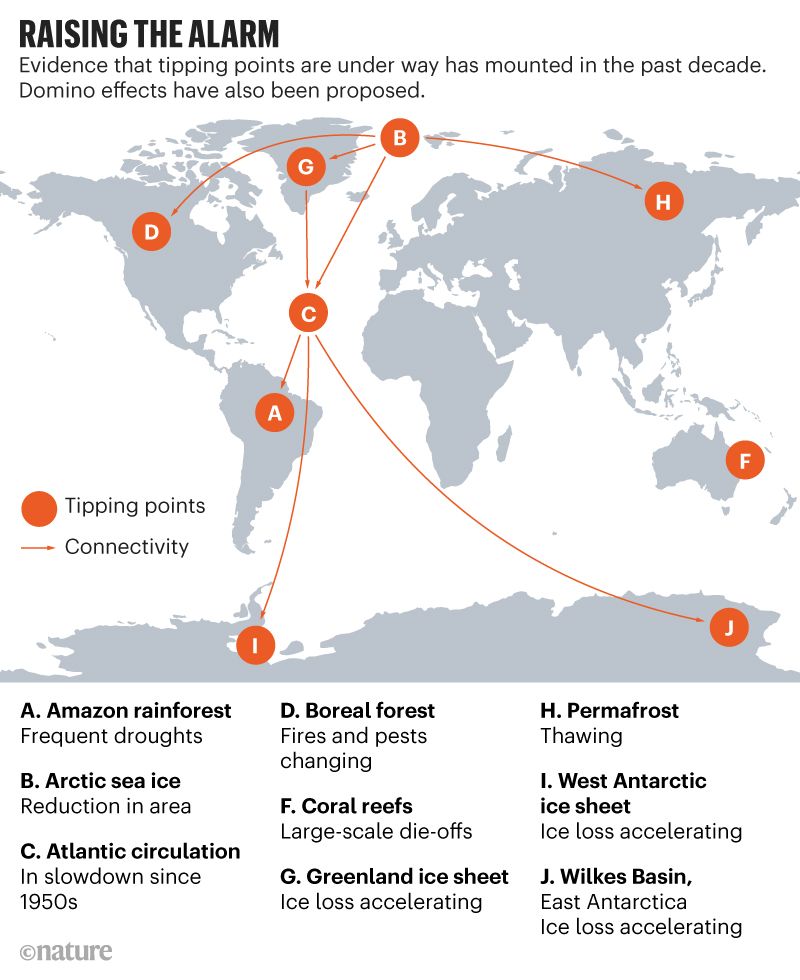
This first one is from a recent report in Nature that finds that we’re coming up – faster than expected – on a series of global tipping points. How these tipping points work and interact is a bit complicated, as you can tell from all the arrows and points on that map. But the key idea is that none of these items is unrelated from each other.
The fires in the Rainforest are both a symptom of climate-fueled draught, and also a cause of the loss of Arctic Sea Ice; which in turn is contributing to slower circulation of the Atlantic ocean current; and on and on.
There are a lot of climate emergencies happening all over the planet, and none of them are un-connected. Wherever you are, you’re likely seeing impacts, and your local impacts and emissions are fueling the crisis somewhere else.
That’s bad news, and really alarming, because these disasters are happening decades earlier than previously predicted, and they’re compounding at increasingly rapid rates. At the same time, it helps to know that we are all truly in this together – just because my coast is flooded and yours is on fire, or vice versa, doesn’t mean we aren’t facing the same problems.
Chart 2 & 3 – Emissions still going up

This one, which should be familiar to anyone who has been in this movement for a few years, is from the World Meteorological Association and shows that global concentrations of Carbon Dioxide are still going up.
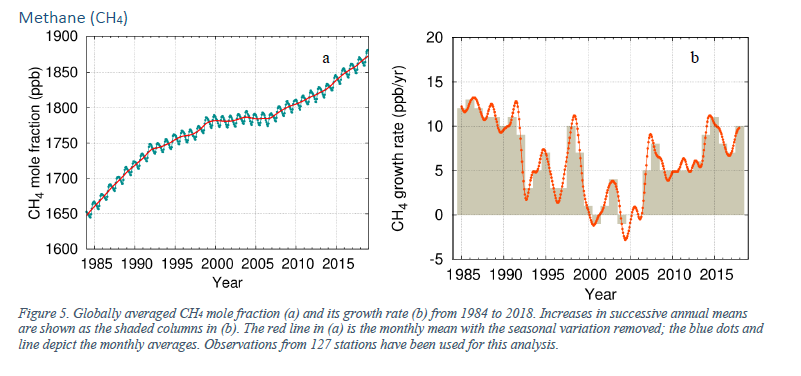
That goes for emissions of methane too – again according to scientists at the WMO. Methane is the key component in fracked gas, and is up to 80 times more potent at warming the climate and created those interconnected tipping points and indicators in chart #1 above. Which is why we spend so much time protesting at gas pipelines and the people who are supposed to regulate them.
Chart 4 – We’re not acting fast enough.
That emissions are still rising is probably not a surprise, nor is the fact that we’re not doing enough to combat the climate crisis. If we were, emissions would be going down, right? But the distance between what we need to be doing, and what we say we are doing is also getting wider.
That was the conclusion of another gut-punch of a report from the United Nations this year, eloquently summed up in our final chart:
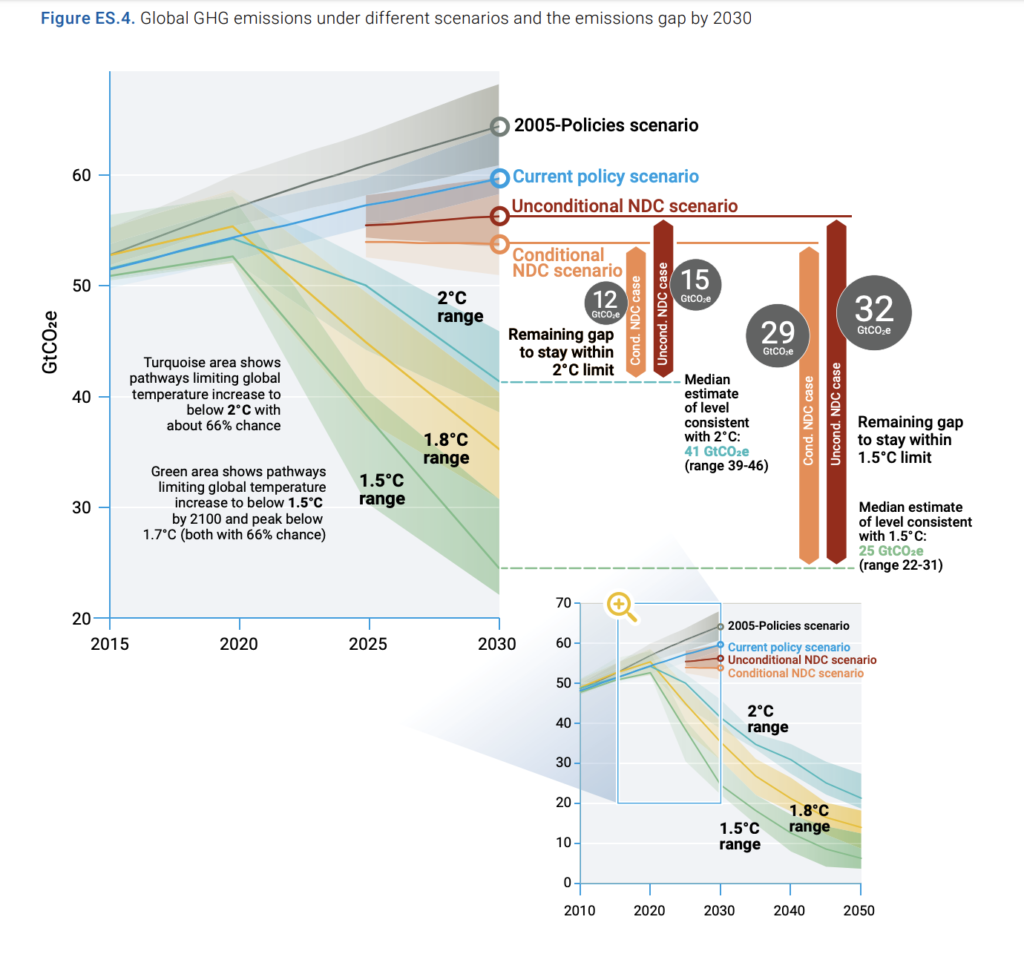
So there it is – the state of the climate movement in 4 charts, and it is NOT good.
- We’re approaching a series of interconnected ‘tipping points’ of climate chaos much faster than expected.
- That’s because emissions of carbon dioxide and methane are still going up despite years of promises by the world’s governments to reduce them.
- Most devastating, the gap between what we say we will do, what we need to do, and what we are doing keeps getting wider.
That U.N. report was described as “Grim,” “Bleak” and “drastic” when it came out. But it was not without hope. The authors of the same report on the ambition gap wrote that, “the political focus on the climate crisis is growing in several countries, with voters and protesters, particularly youth, making it clear that it is their number one issue.”
Next week I’ll be back with a photo and video year in review of some of the amazing work we’e been a part of this year – from challenging Trump’s corrupt, climate denying cabinet; to shutting down DC as part of the global climate strike; and much much more.
Pingback:Thanks for being a donor. | 198 methods