The News from New York City
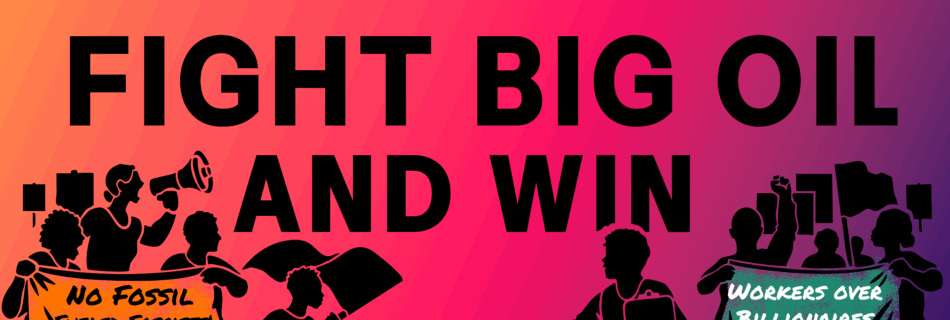
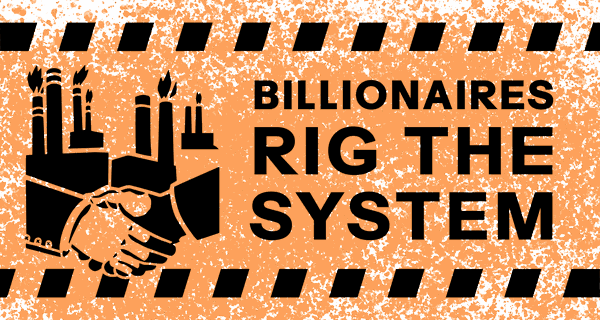
Just a quick report back from New York’s climate week and United Nations General Assembly with lots of photos and videos. First, a little bit of context: All year we’ve been talking about how fossil fuels and tech billionaires are teaming up to promote fascism and pollution. So when we made plans to come to …